Examples of cell cycle analysis menus: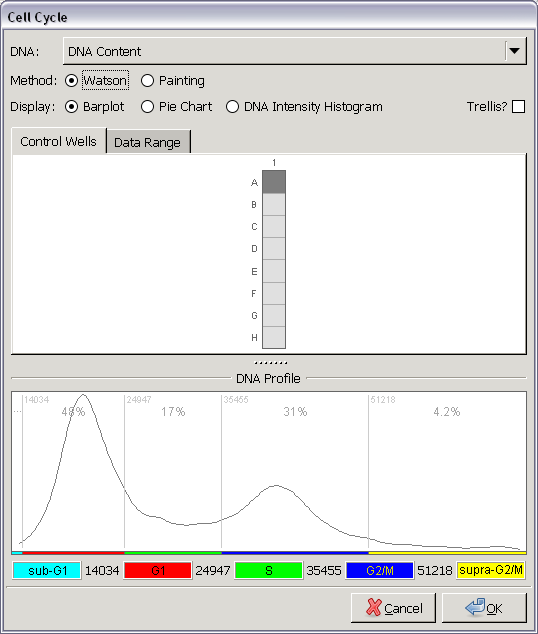
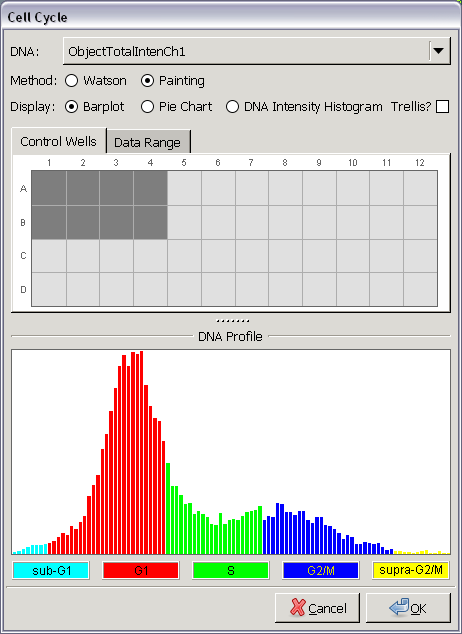
The plate map in the "Control Wells" page is for selecting
control wells. Control wells are used
to compute cell cycle phase boundaries.
Once we have phase boundaries, data in all wells are classified
into one of the cell cycle phases and the result can be displayed
as a barplot, a pie chart, a DNA profile, or a trellis of any one
of the three plots.